Trading GBP/USD

K
@kehinde - 4 months ago

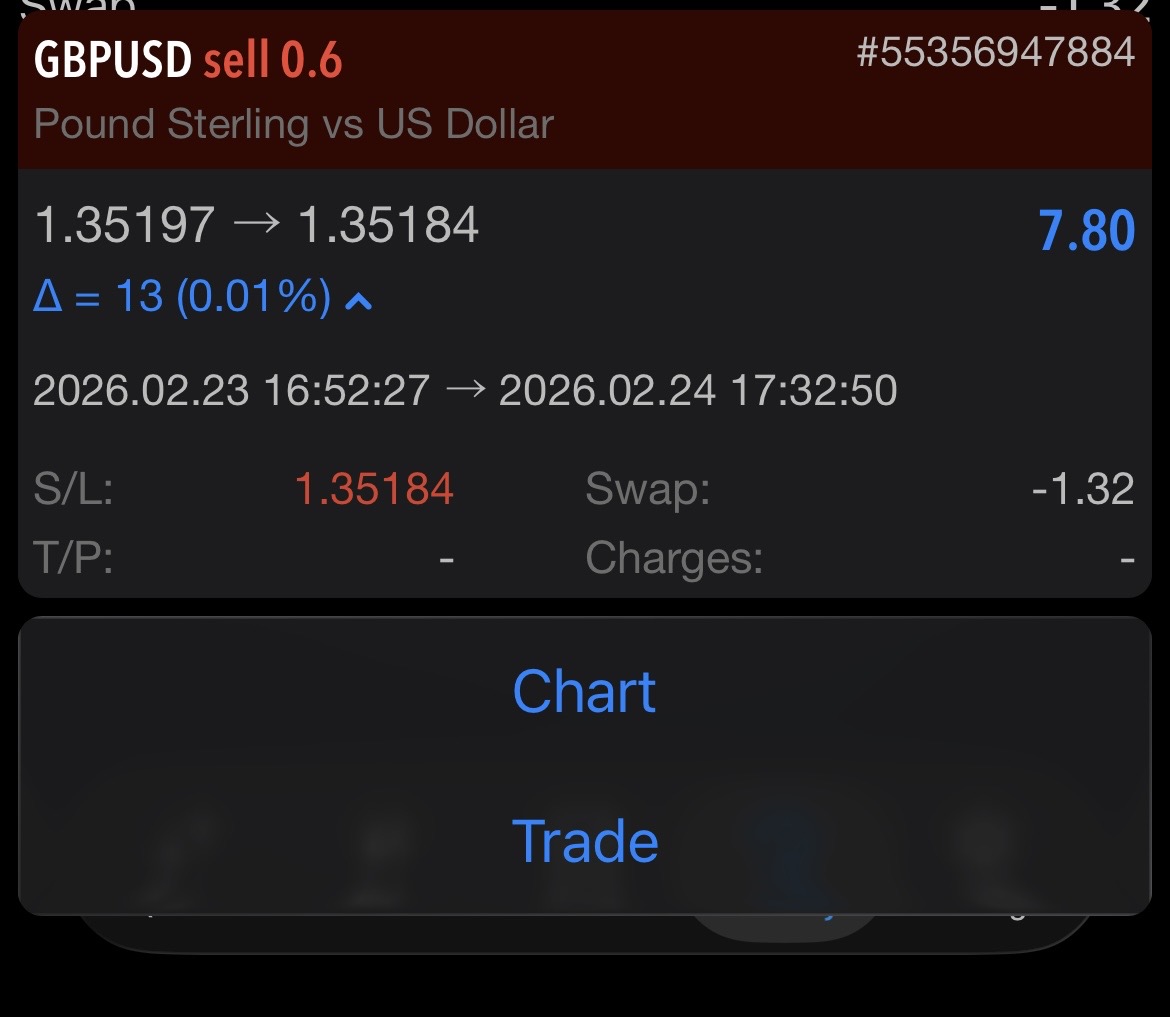
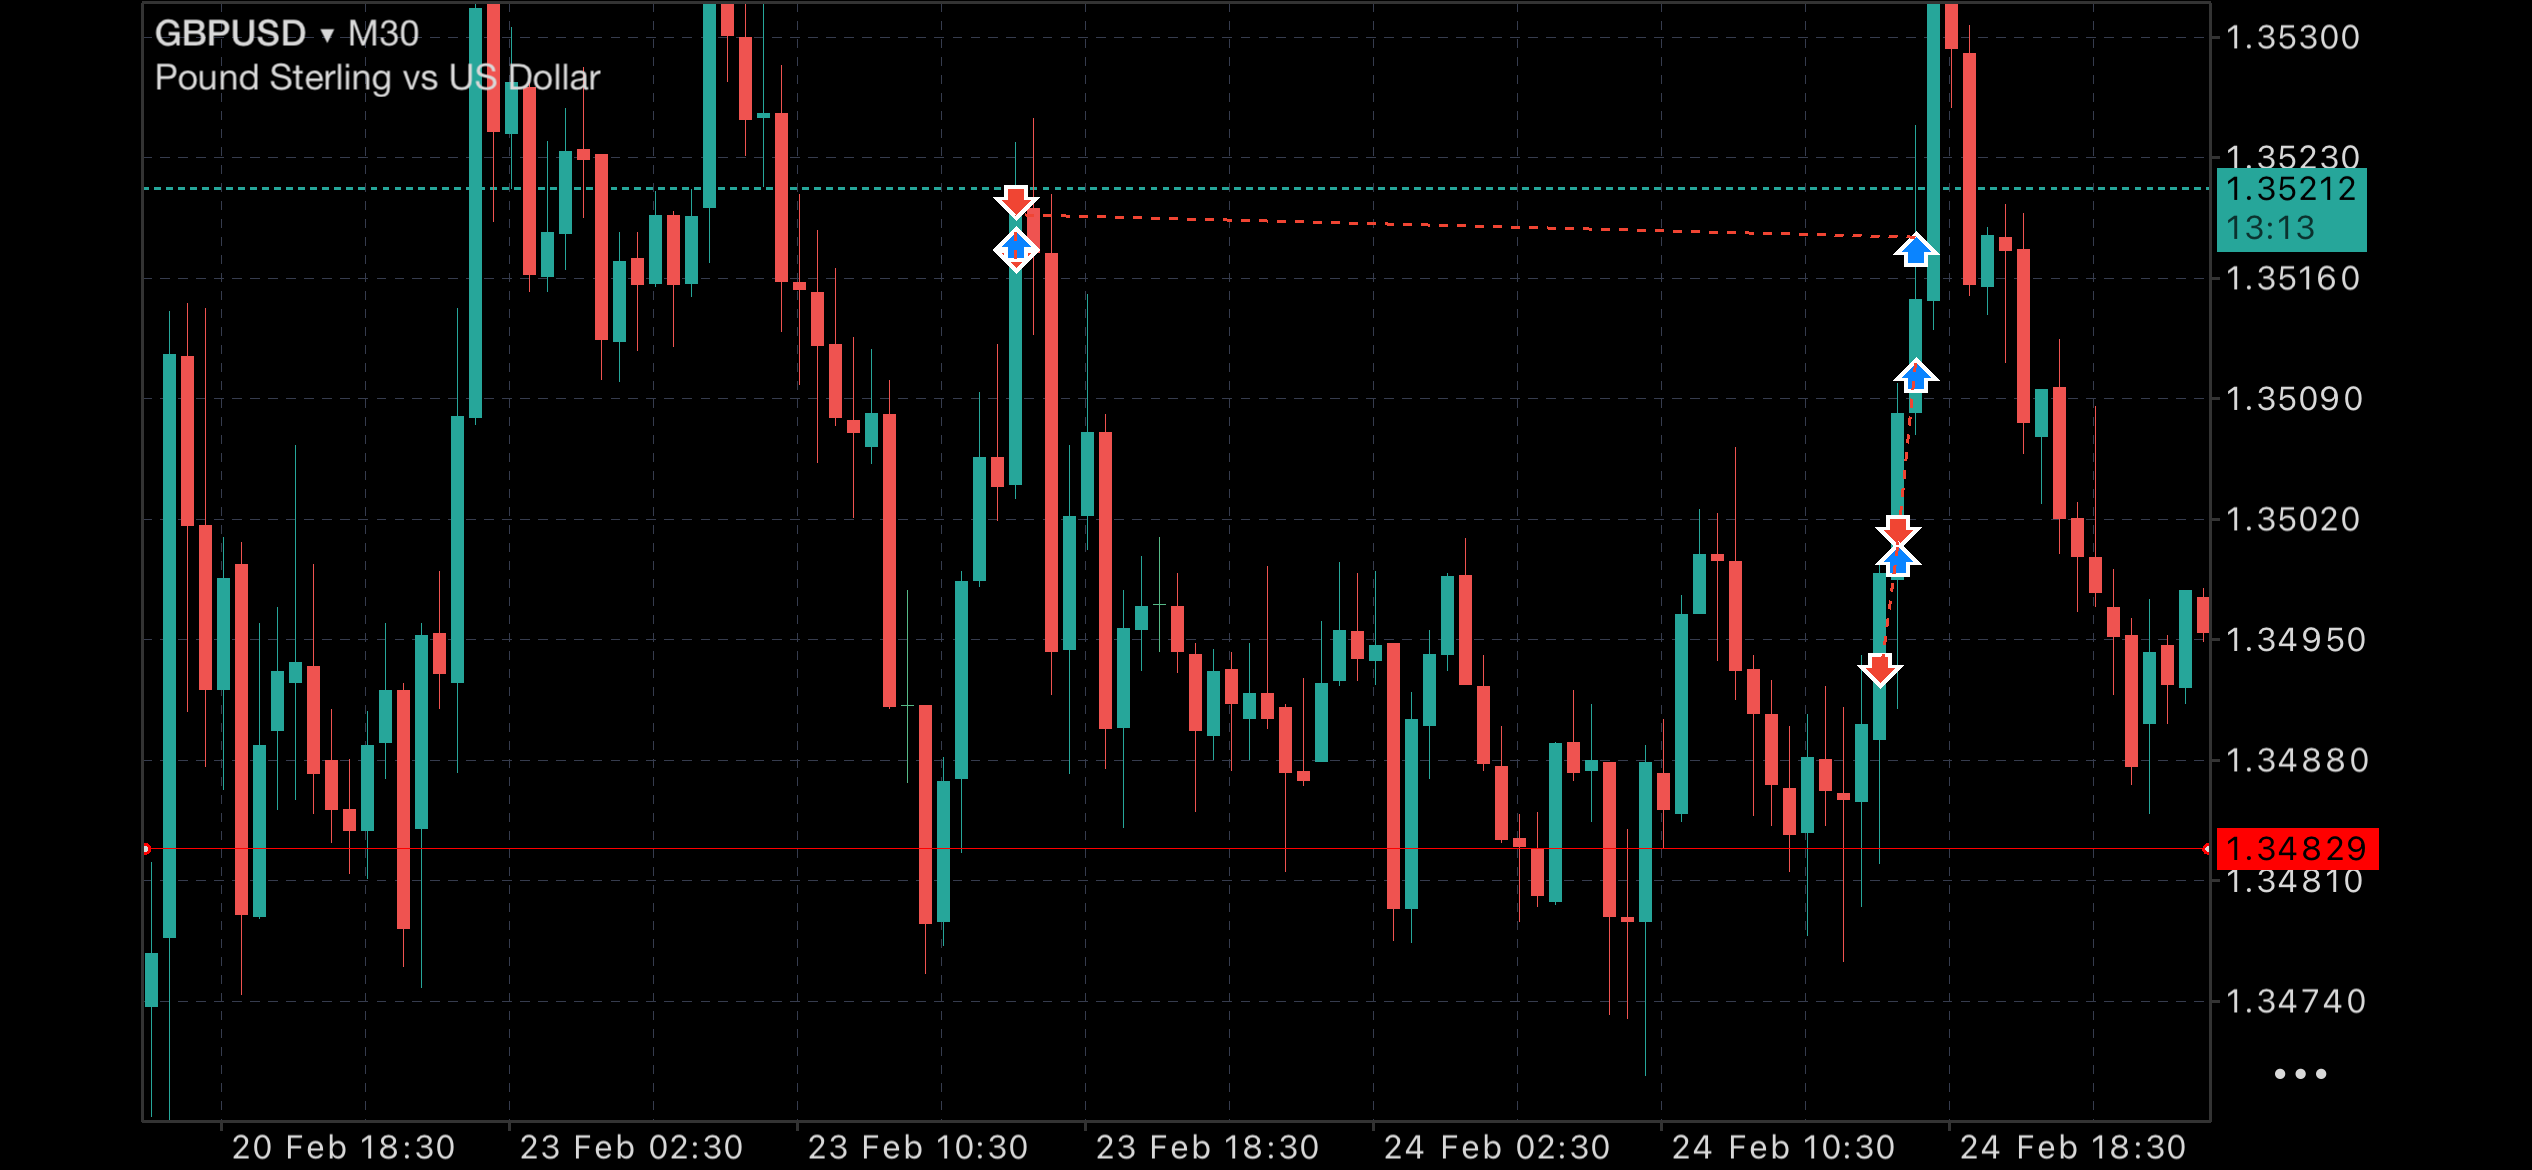
Yea trade history is on MT5 and it shows a map of where you enter and exit a trade. A picture tells a thousand words they say!

Y
@yokoyi - 4 months ago

If youre using MT5 you can activate the trade history feature so it shows like in this image.

Y
@yokoyi - 4 months ago
Quoted - headies25284

Is it this?

Yes, but you can set it to 5 or 15 minutes time frame so we can see more detail

H
@headies25284 - 4 months ago

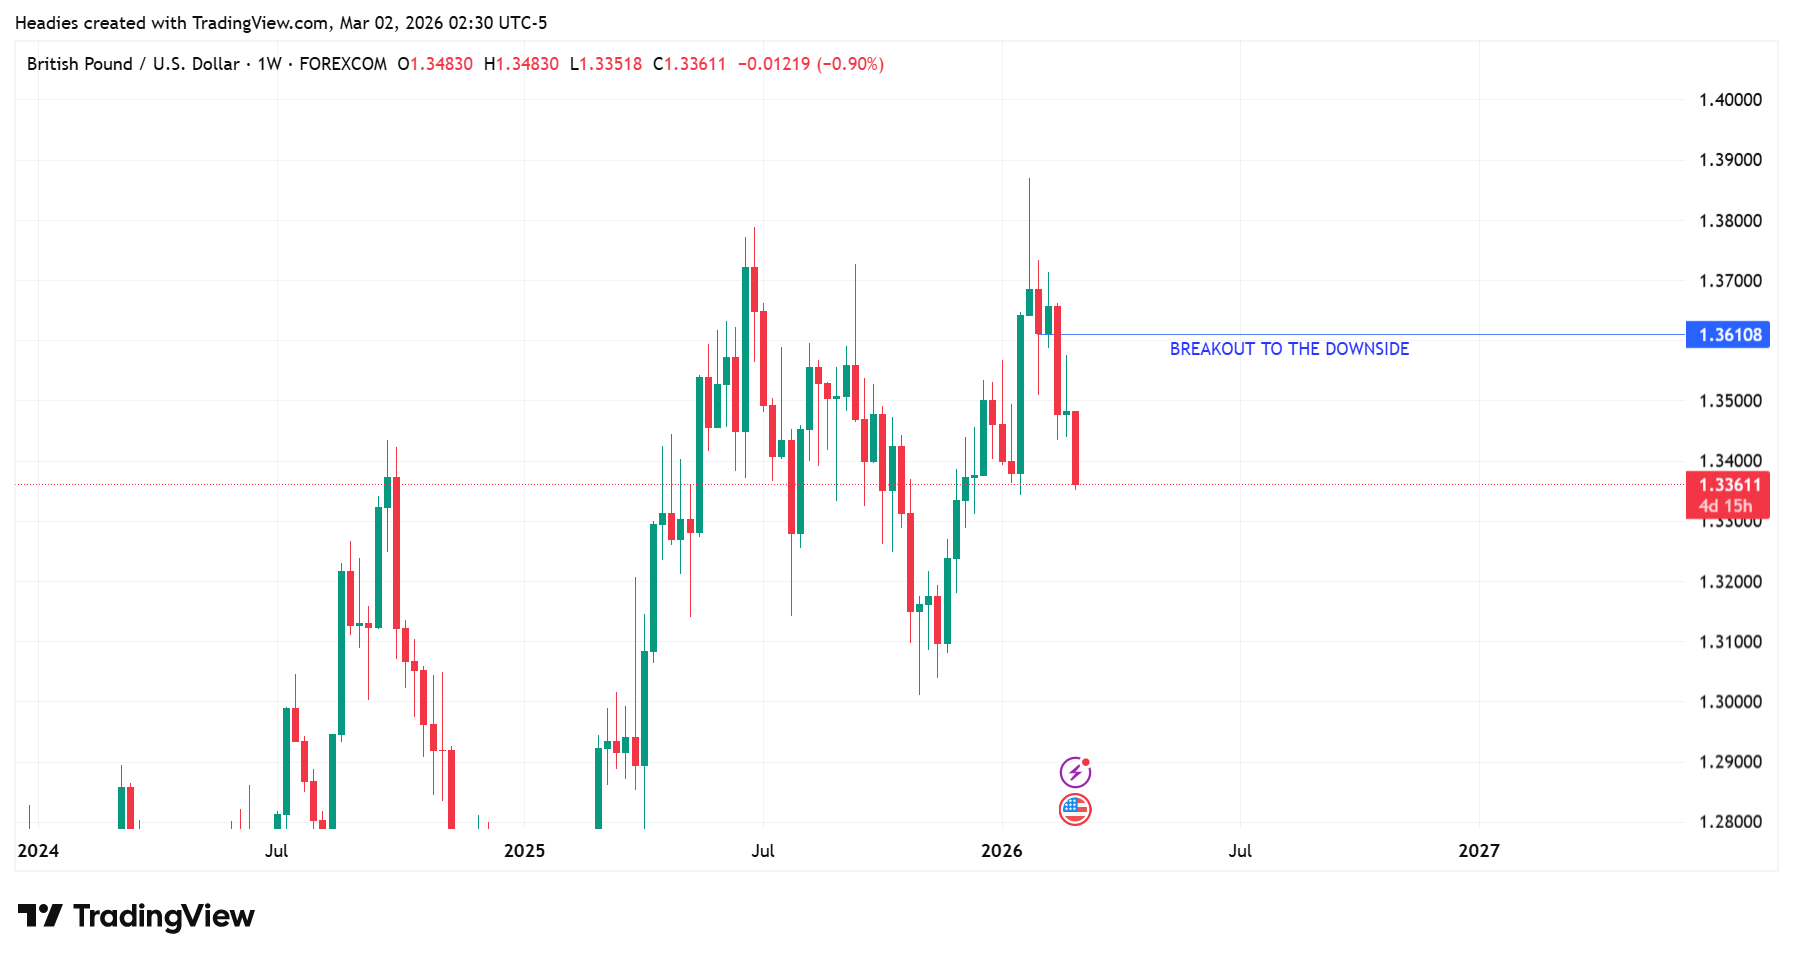
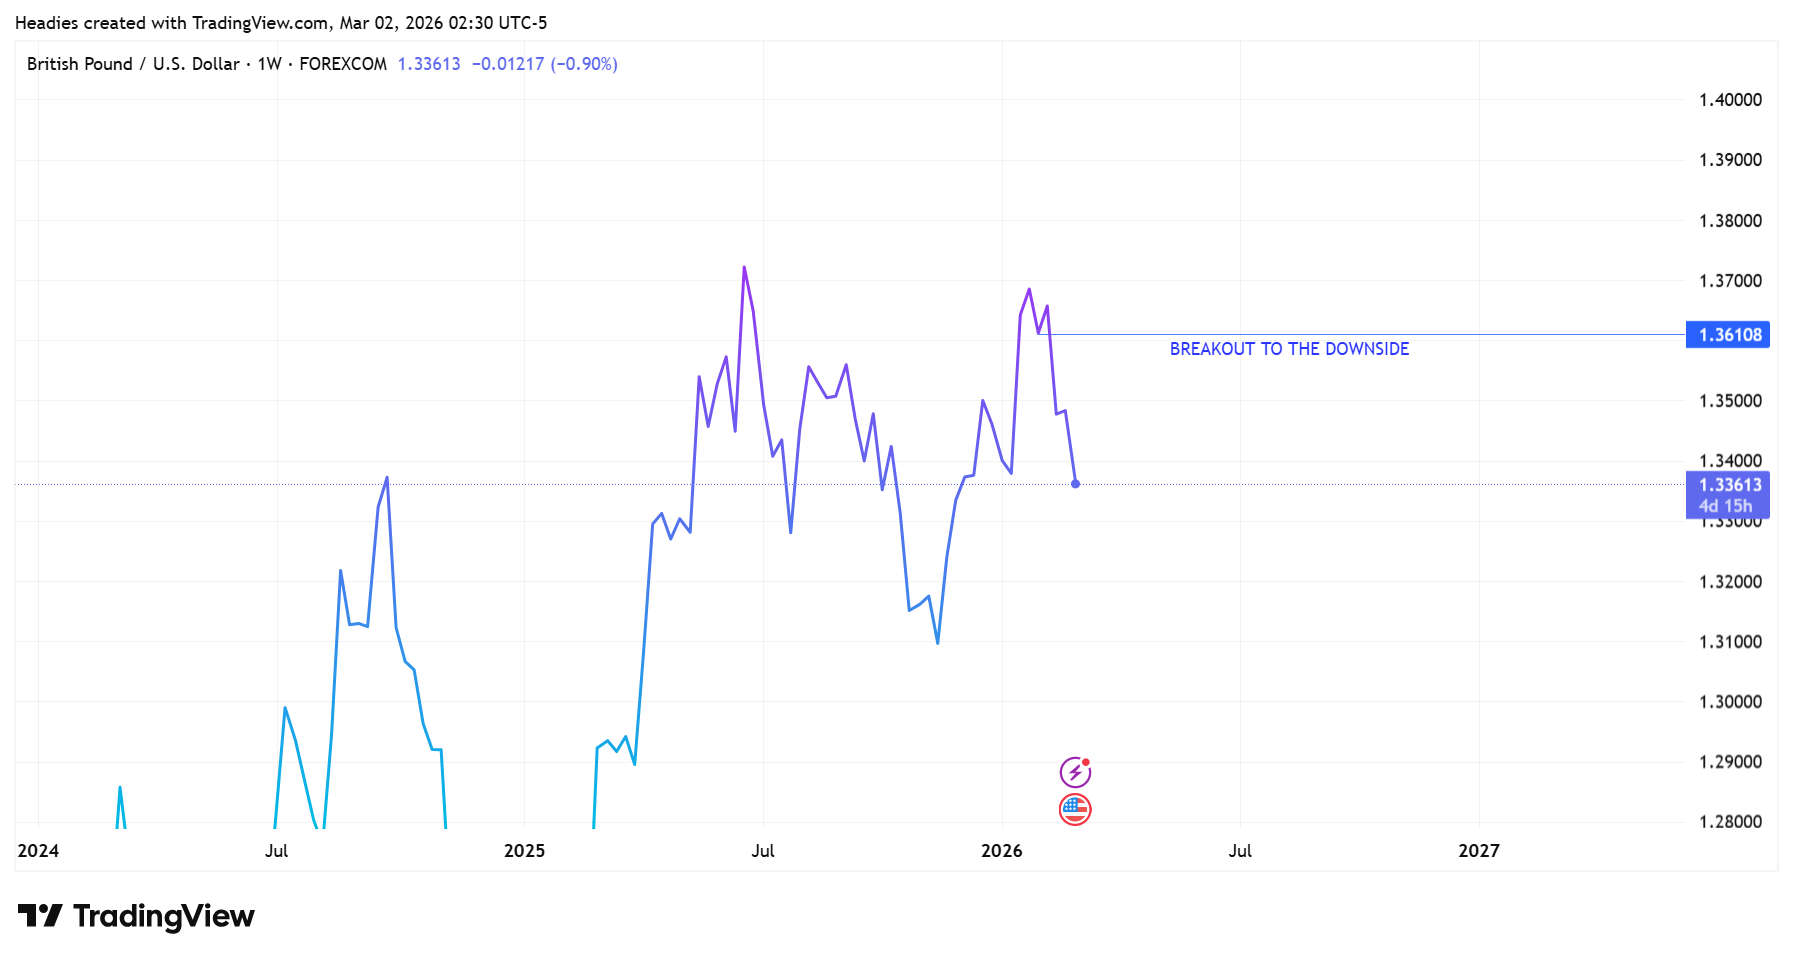
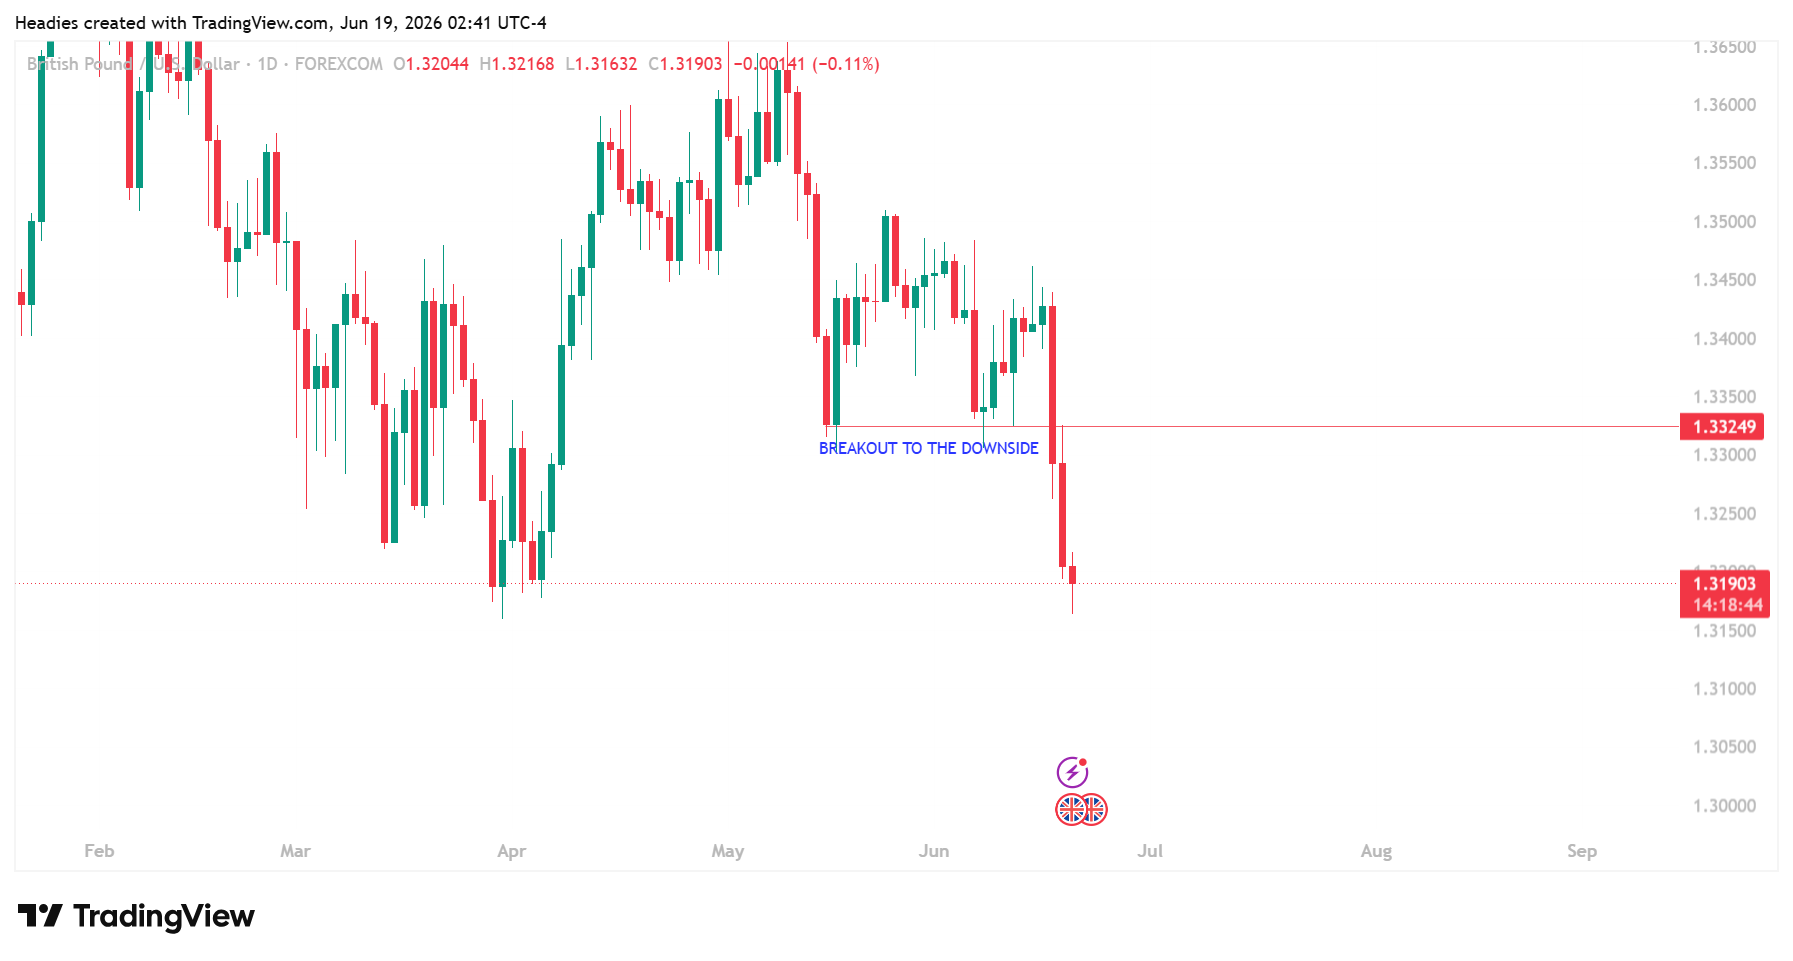
I AM BEARISH ON THIS PAIR UNTIL MARKET PROVES OTHERWISE COS WE HAD A BREAKOUT TO THE DOWNSIDE ON THE WEEKLY TIMEFRAME AS SHOWN IN THE IMAGE ATTACHED.

H
@headies25284 - 4 months ago

WEEKLY PROJECTION.

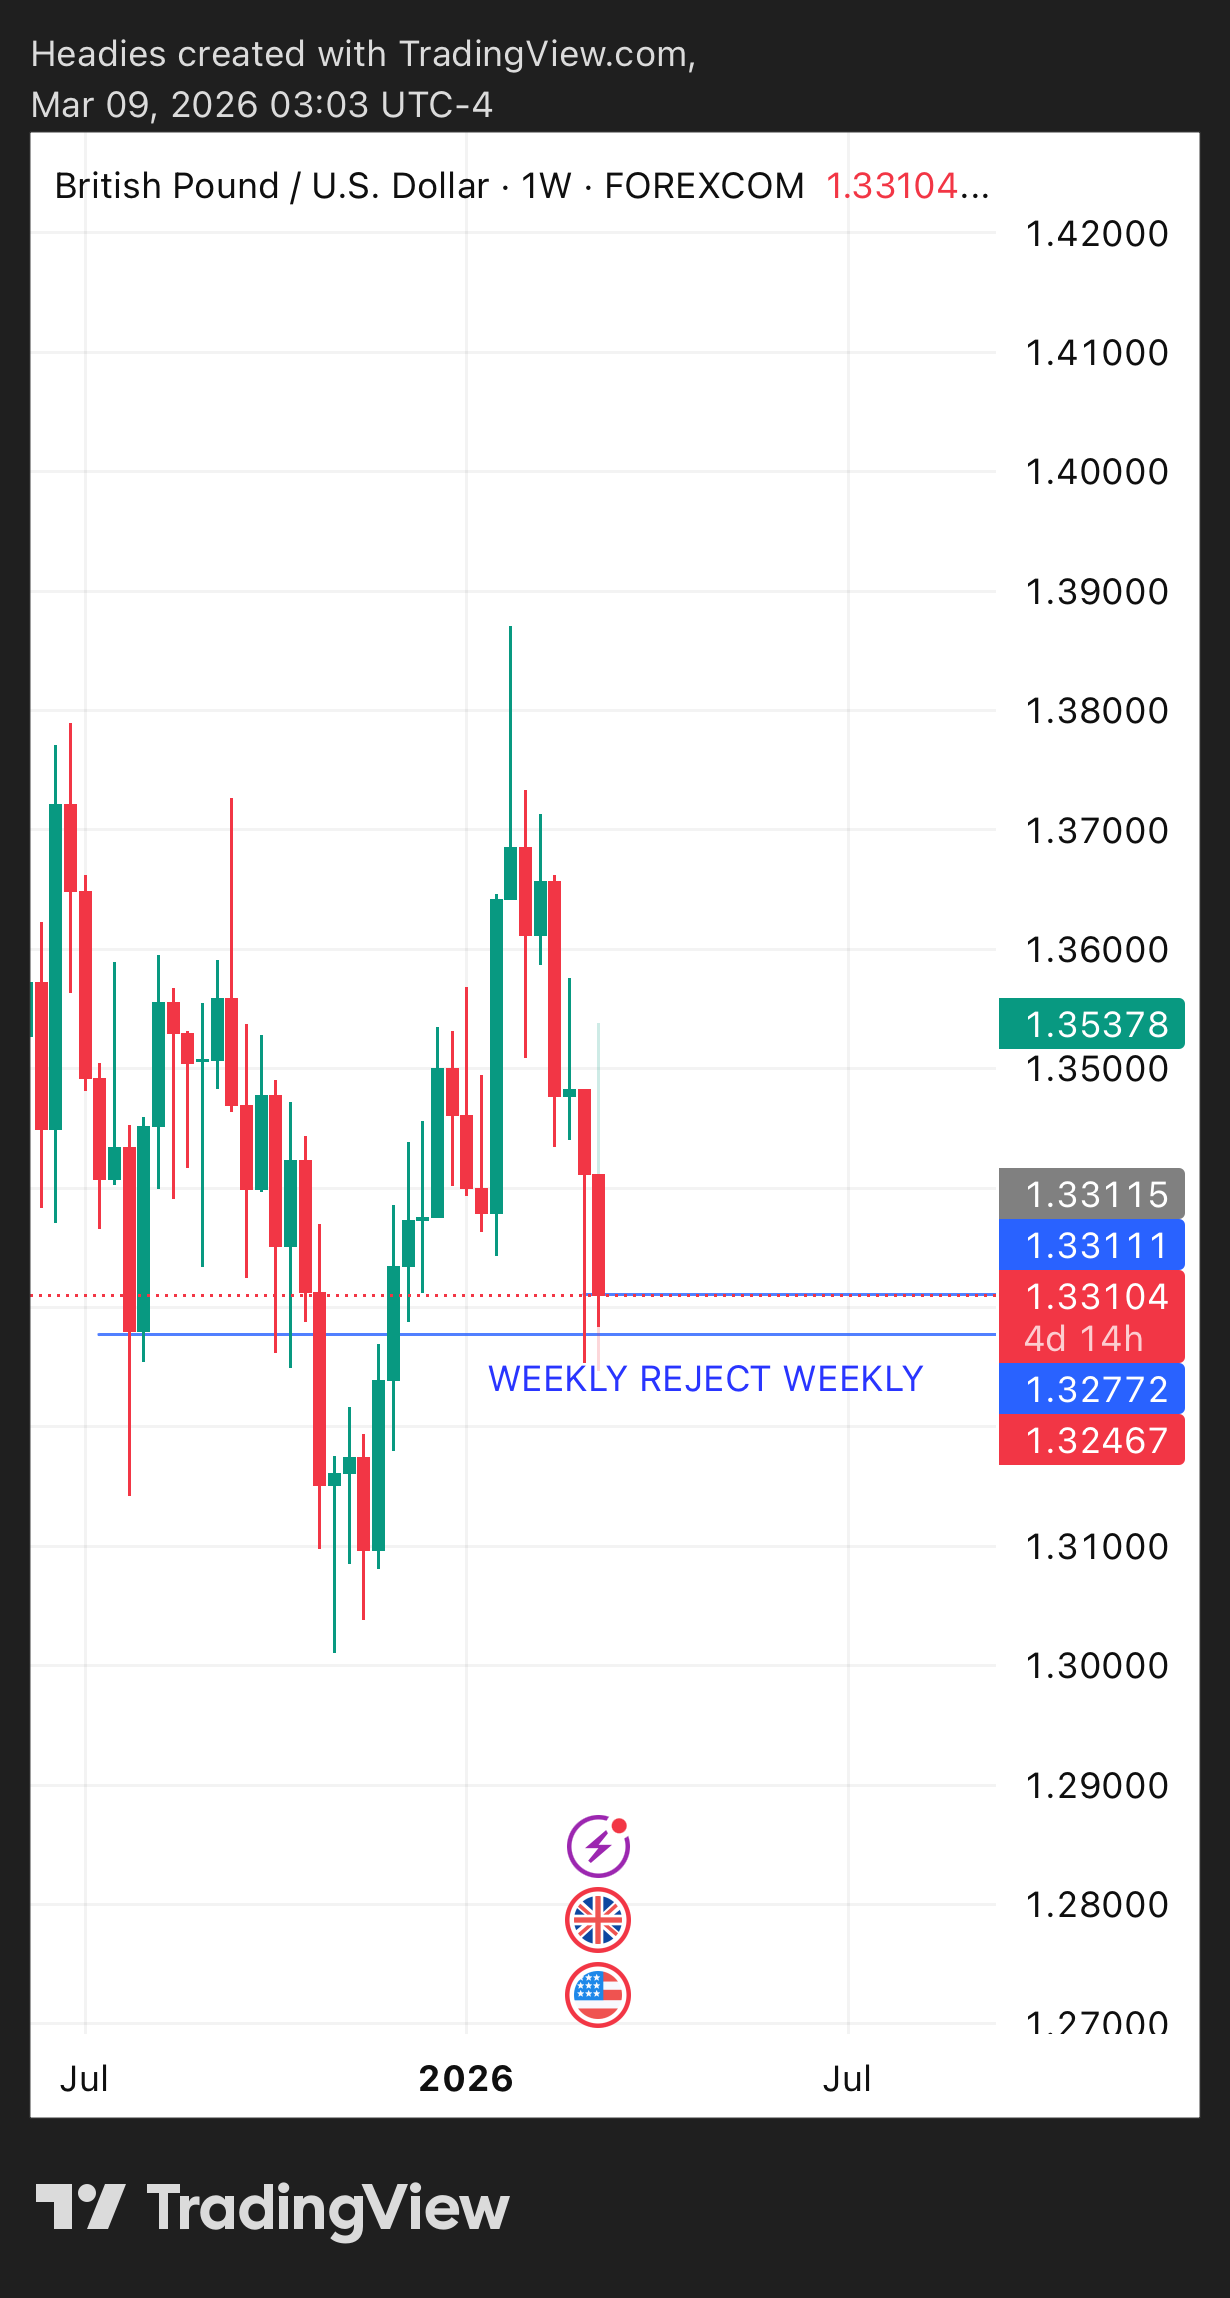
Last week candle rejected off a keylevel and closed above it. This signifies a buy but we need to check for confirmation on daily timeframe. On daily timeframe, we need to see a breakout to the upside to be sure of what weekly is showing us.

H
@headies25284 - 4 months ago
Quoted - headies25284

WEEKLY PROJECTION.

Last week candle rejected off a keylevel and closed above it. This signifies a buy but we need to check for confirmation on daily timeframe. On daily timeframe, we need to see a breakout to the upside to be sure of what weekly is showing us.

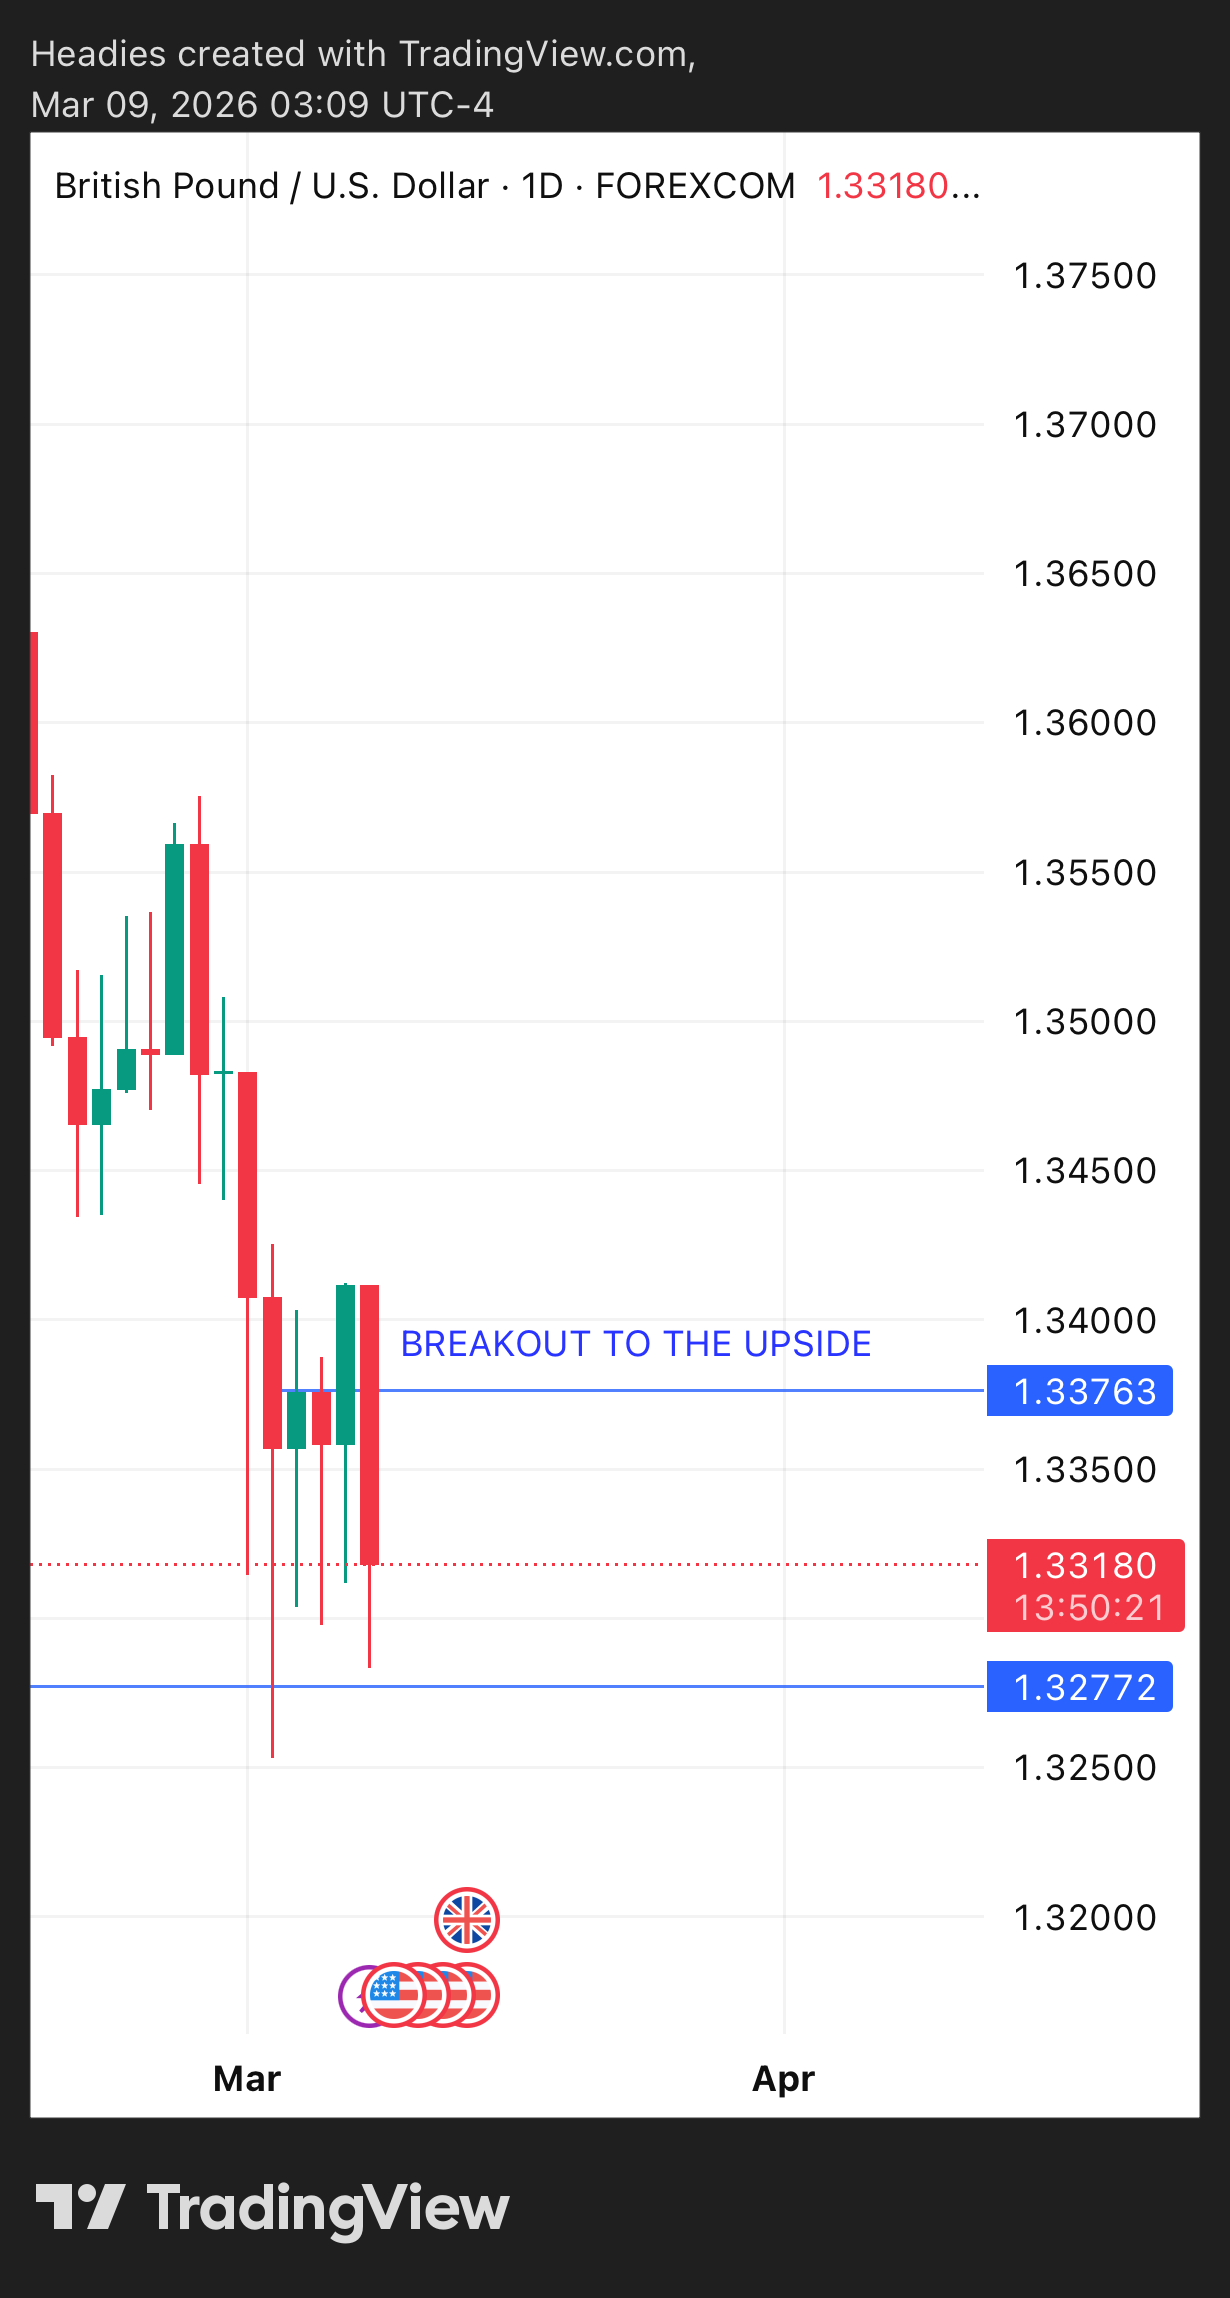
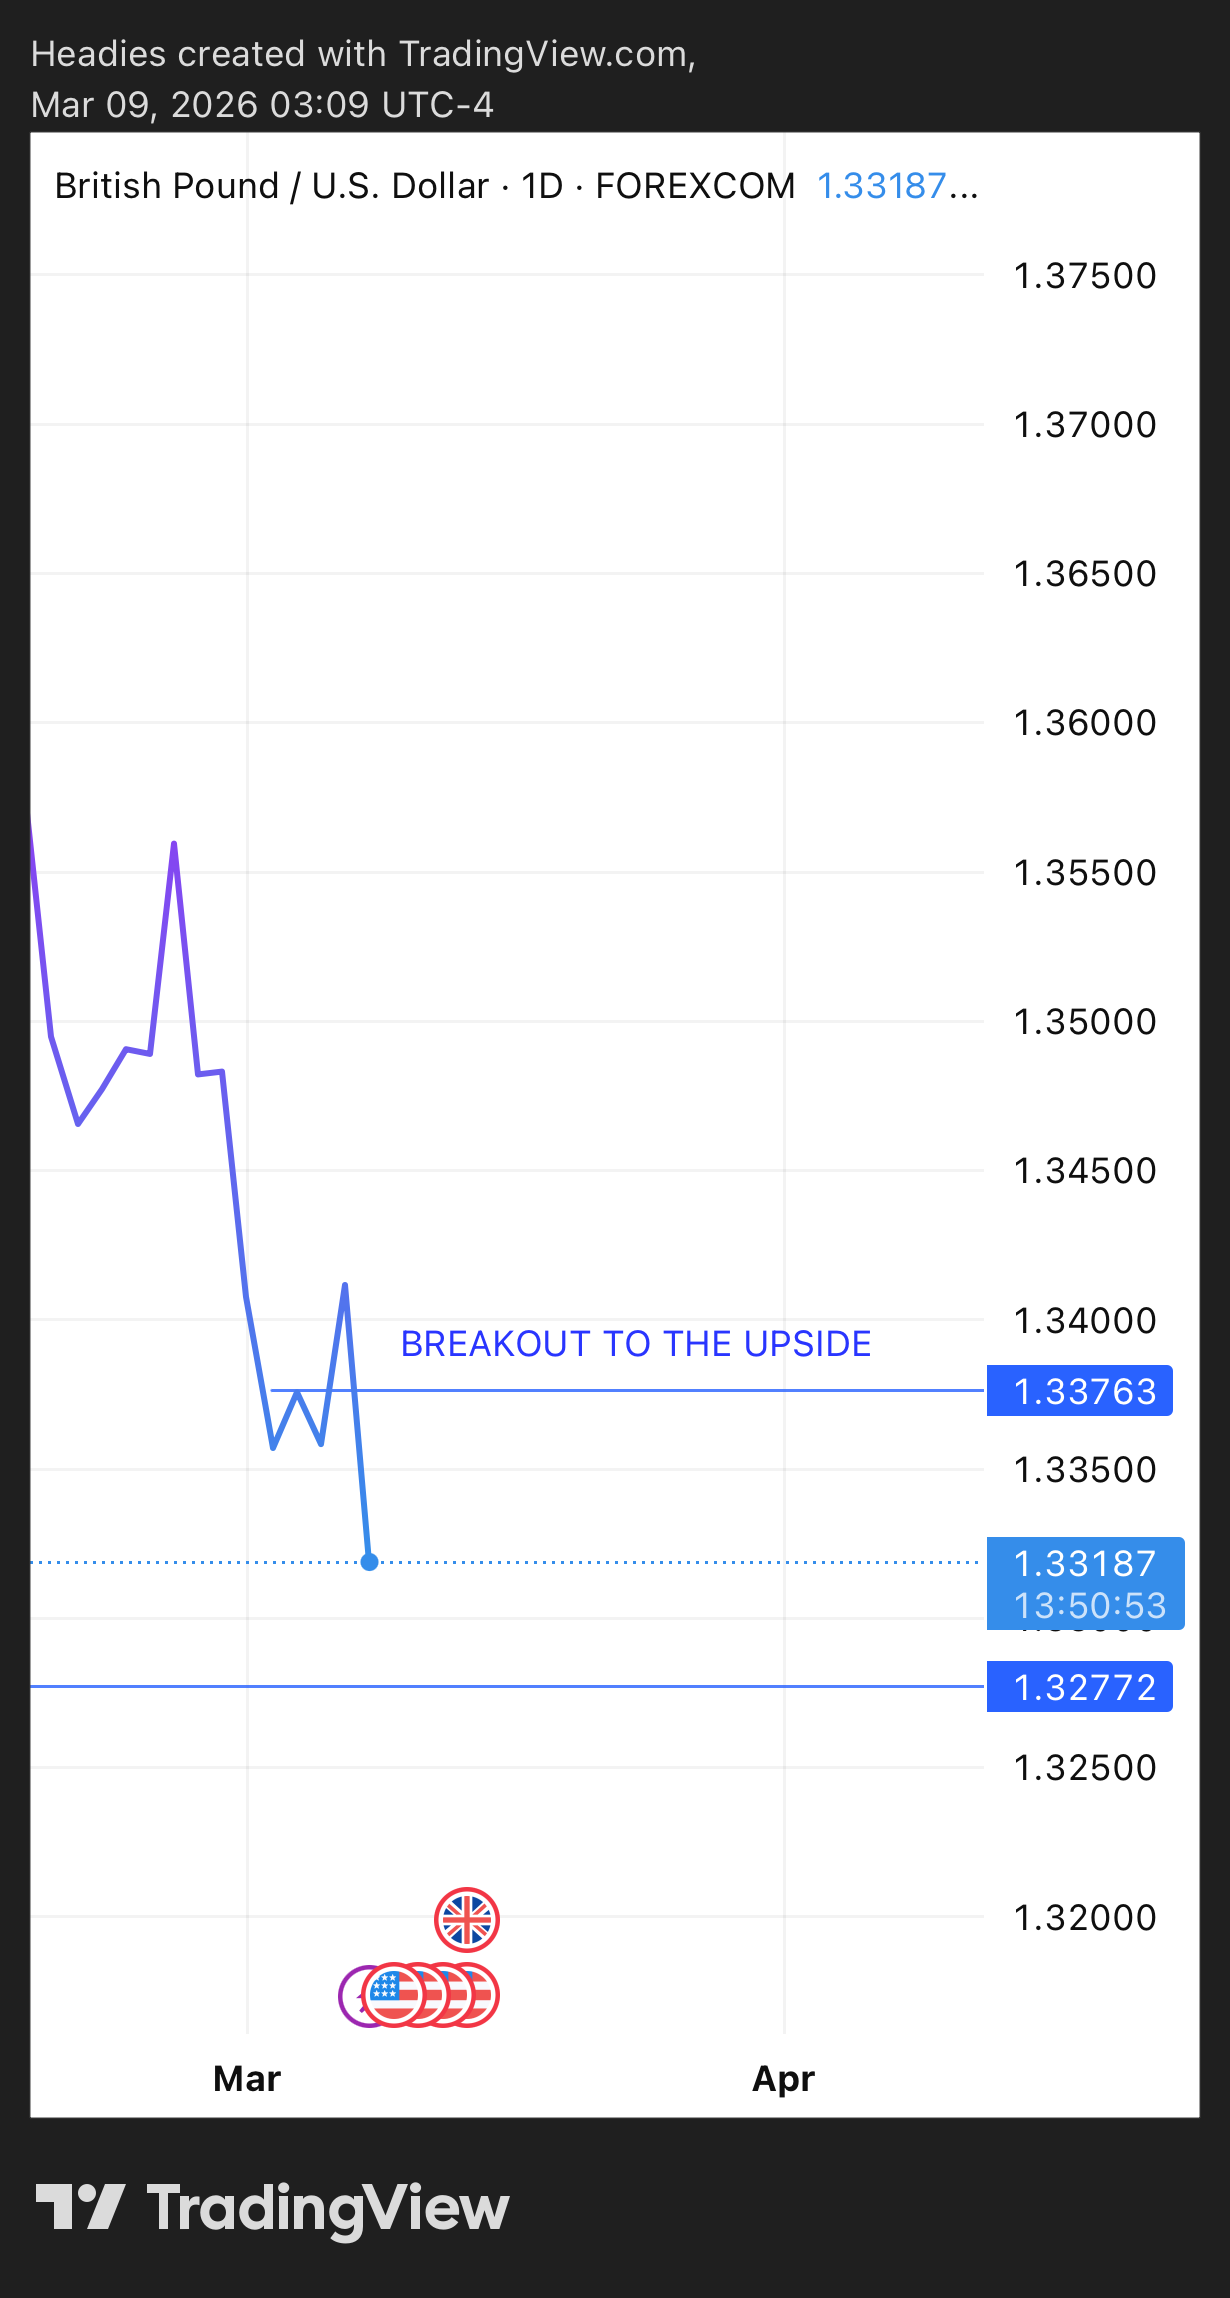
Here on the daily timeframe, we had a daily breakout to the upside. This daily breakout to the upside is a confirmation of what we saw on the weekly timeframe. I will be looking out for buys all through this week.

H
@headies25284 - 3 weeks ago

Fundamentally, GBPUSD is bearish. why? The UK government is borrowing more money. It means GBP will get weaken.

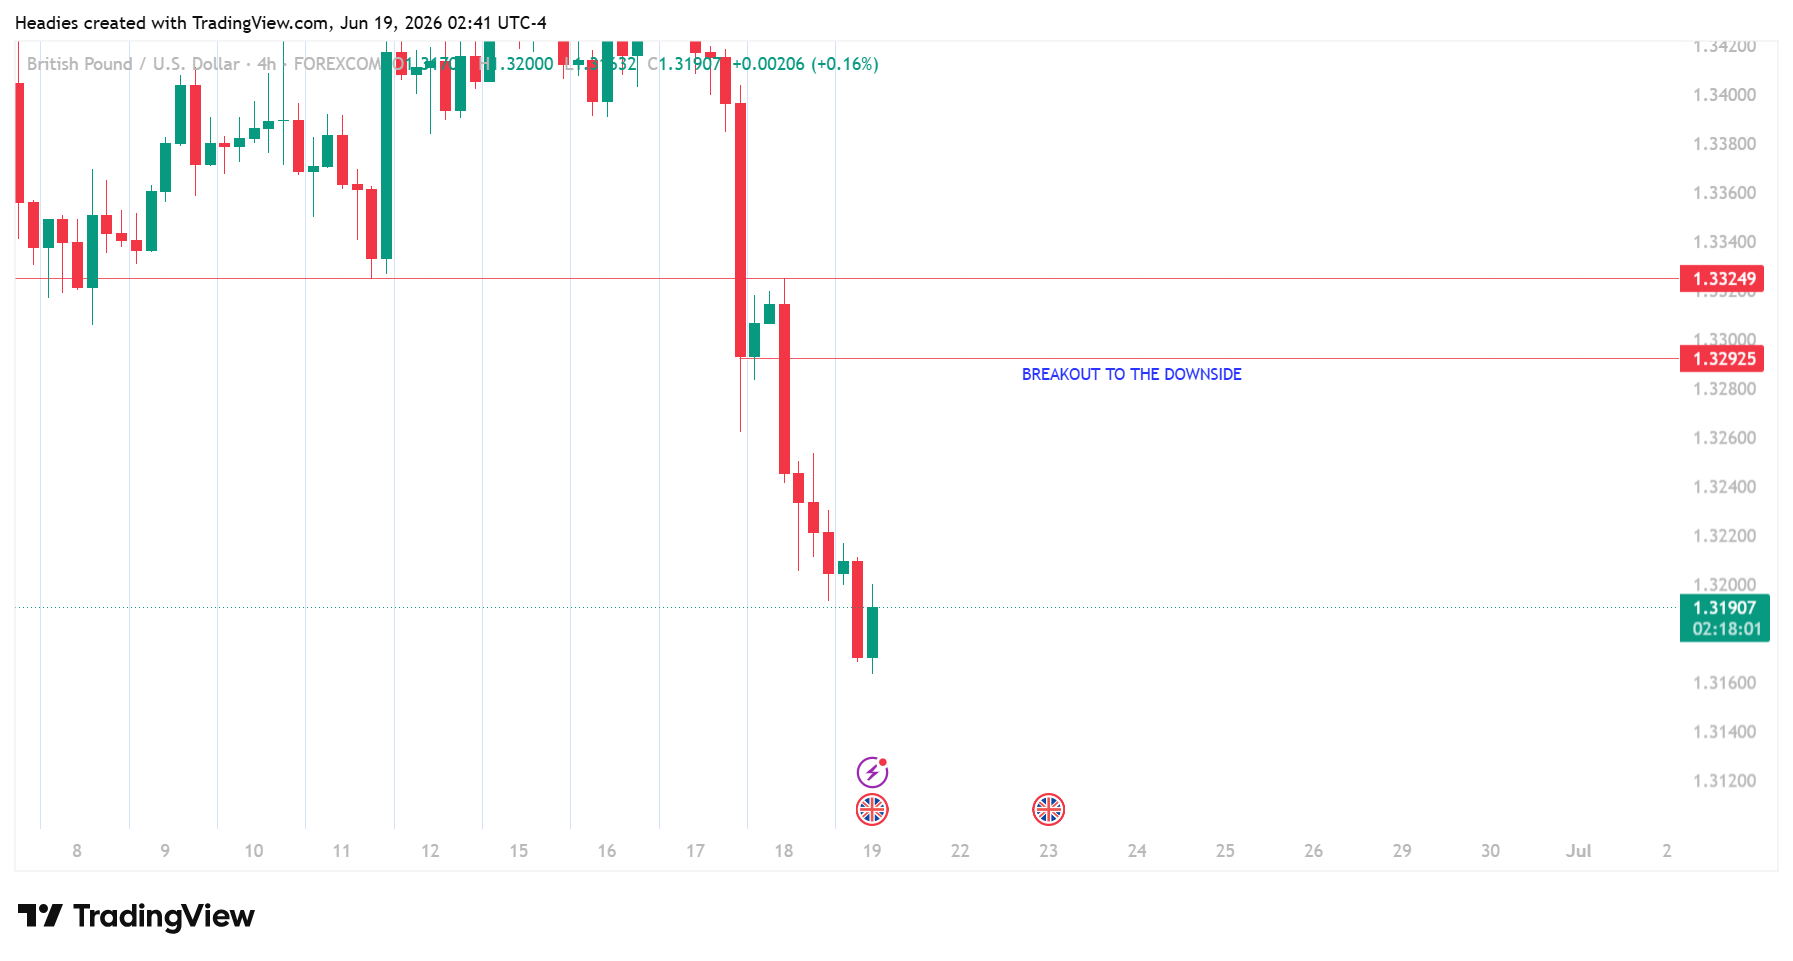
From a technical standpoint, both the daily and 4-hour timeframes are showing a clear downside break, which aligns with the current fundamental backdrop. GBP is strongly leaning bearish, and the overall structure is pointing toward continued selling pressure.

H
@headies25284 - 3 weeks ago
Quoted - yokoyi

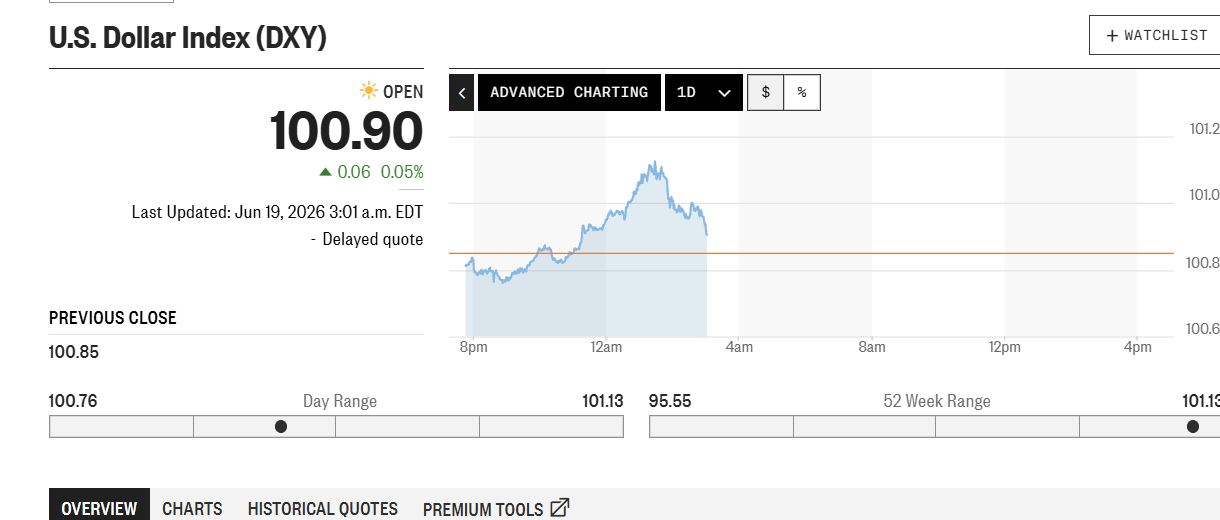
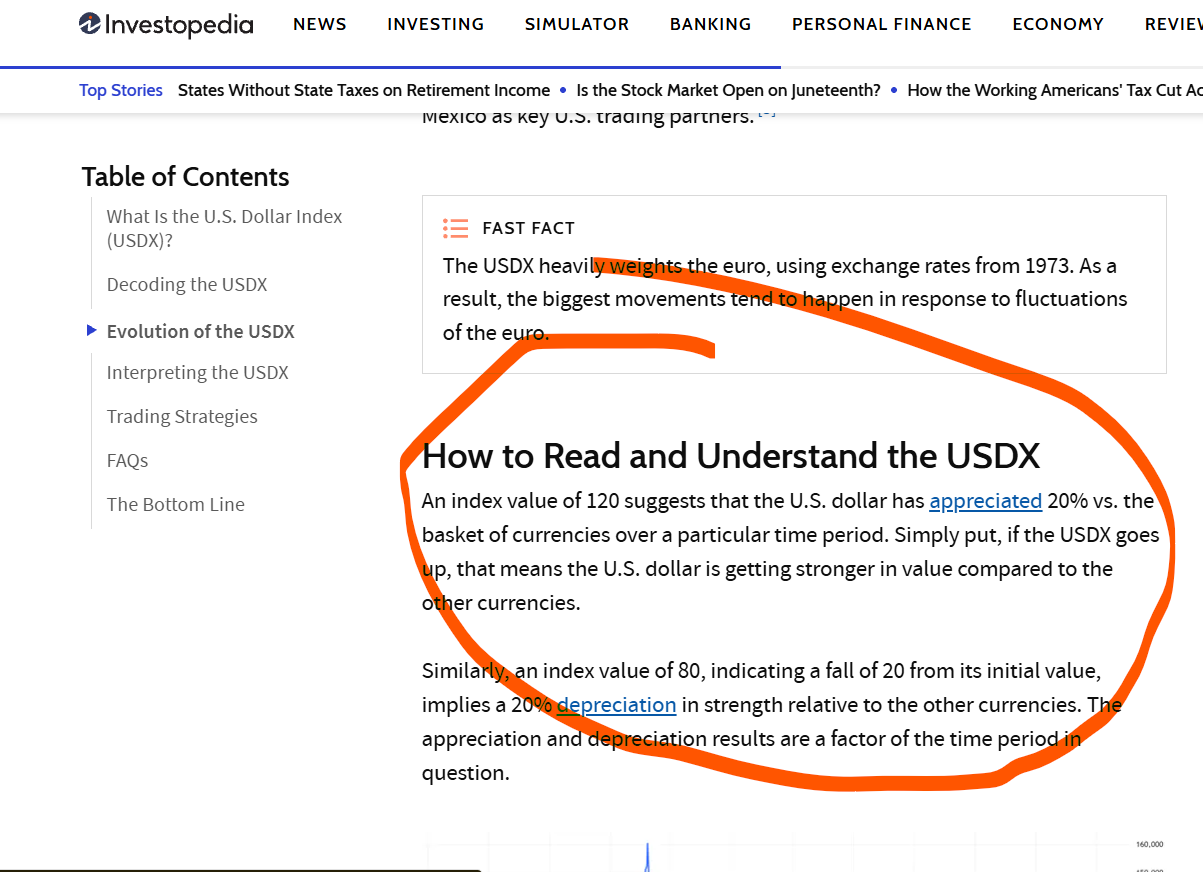
DXY is also above 100. In fact the DXY is 100.90 meaning the USD is stronger than major currencies by 0.9%

DXY at 100.90 does not mean USD is stronger than majors by 0.9%. That’s not how the index works.

DXY is an index value, not a percentage. The baseline of 100 comes from a 1973 reference point when the Bretton Woods system ended it’s not a percentage above parity. At 100.90, it simply means the USD is roughly where it was at that historical benchmark, trading slightly above it. The 0.90 is an index point, not a percentage gain over other currencies.

P
@patrader - 3 weeks ago

I don't think DXY is going to be long in the coming months. I hardly believe an innocent reasoning such as borrowing would indicate any changes towards existing trend.

US dollar has taken a significant hit after trump reelection prompting the pull out of money from the US. The world will continue towards de-globalization. The world would look inward investing in local economies rather then looking at the US. France has been pushing for decoupling from US tech. Chinese has publicly instructed the local regional government to use local alternatives.

Sure the AI wave will draw capital to the US but i think we are still on track for DXY decline.

Even if you were to believe DXY going up. DXY is a risk proxy and hence a risk on trade, with iran war resolution. I think net sentiment should have become neutral dollar not bullish.

EU and GU should both continue their uptrend GU heading toward 1.4500 and EU to 1.25

K
@karbin - 3 weeks ago

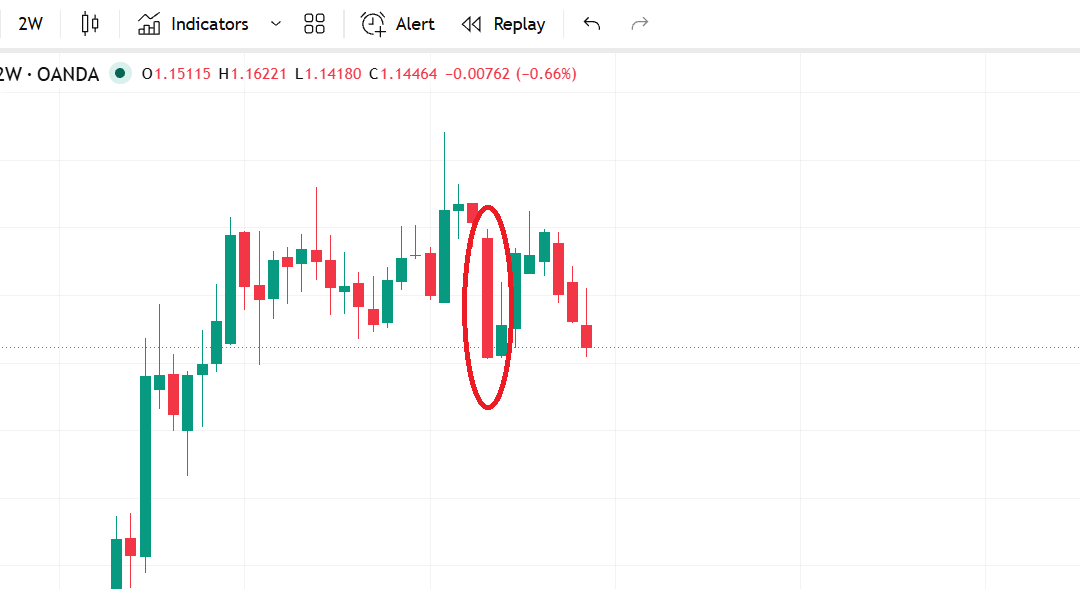
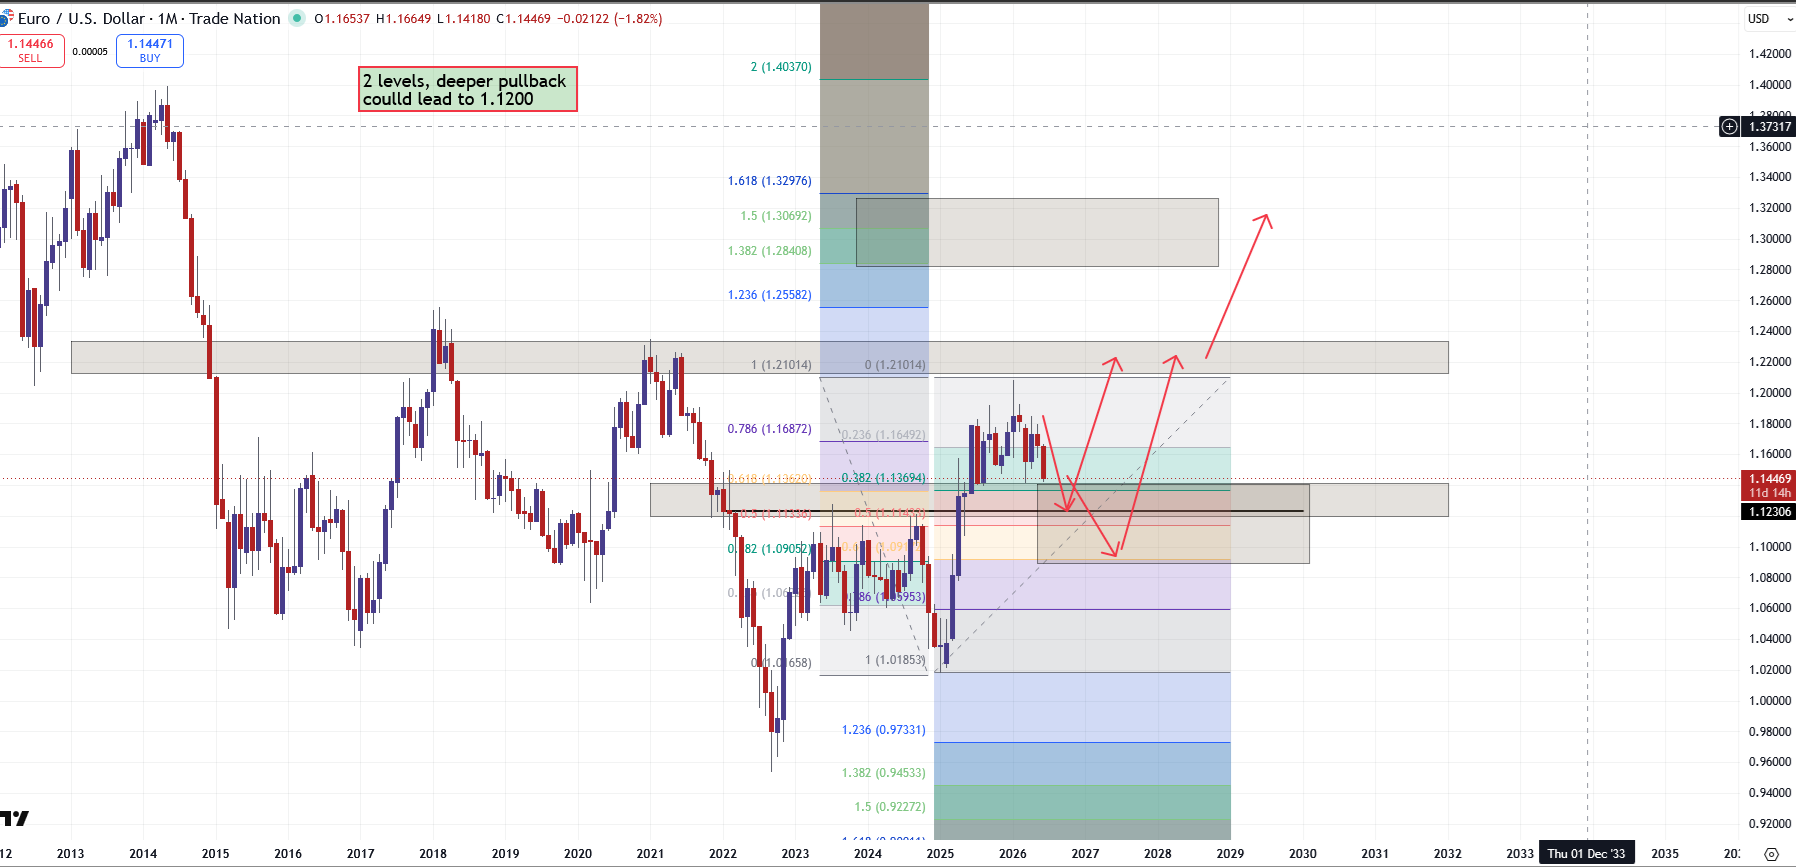
DXY is mostly EURUSD. EU dropped during the first 2 weeks of war (see highlighted circle), since then it has done nothing. It has tested its high & low of that drop, but not broken that high or low.

If the Dollar was really that strong, then this risk off event should have hammered the EU (GBP moves along as well). But it has not. It has just traded sideways.

I can change my bias if the facts change, but I do think, EU will still continue the leg up that started last year. I'm not a long term trader, but it does not look like a sell, it has gone sideways since July 25, and you buy the predominant trend.

P
@patrader - 3 weeks ago
Quoted - headies25284

Well, i just learnt from what you posted. Above I’m going to prioritize my technical knowledge above fundamentals in the coming months.

When EU was falling and at .9800 some guy was citing bank of america analyst report that EU should go to 8500. this was one of those paid market intelligence service. He was wrong.

Market goes overboard on things always. EU rebounded without touching 9500 followed the exact path it followed when trump was elected last time went up. I am intraday trader i did not make money on that swing trade but on daily chart technicals worked same support worked and it went up.

We should assume EU up till we get a lower high or major breakdown. Target the nearest major Yearly resistance. EU loves to do climax bar when you see long elongated selloff that is when you run, that would be the end of the sell off.

K
@karbin - 3 weeks ago
Quoted - asuquokelvin

So what are you really saying are you changing your bias?

No. I would still be long EU if I were a higher timeframe trader, and target 1.25. Wait for a bullish trigger on the weekly & then long it. Right now, the level is there, but no trigger to long it.

Maybe the next week, we will have something. Maybe we even pullback to 1.12, but it does not change the point, DXY is in a downtrend since Jan 2025.

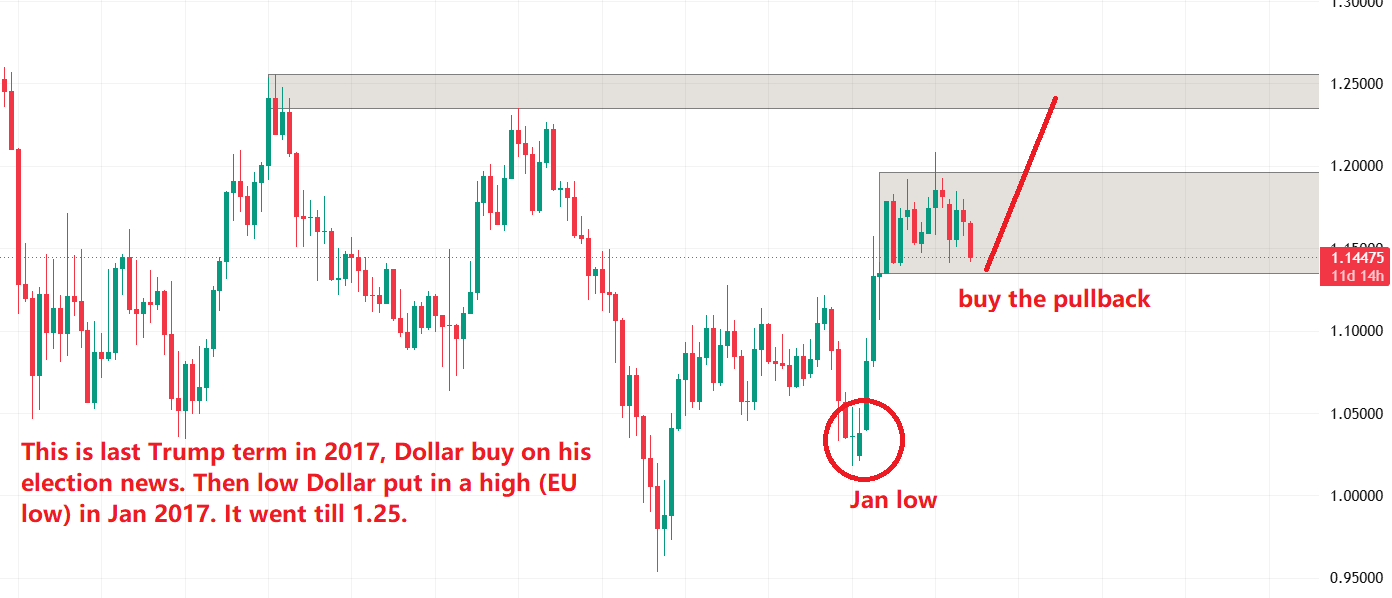
Isolate the last Trump term & see.
Nov - Dec 16, election news, EU drop.
From Jan 17 - major EU uptrend.

Now compare it to this term, very similar.

And then compare it to the Biden term
Nov - Dec 20, Biden election news, EU up.
From Jan 21 - major EU downtrend.

These look like policy cycles. I don't see EU going down before 1.25.

Disclaimer:

At MyTradingLand.com, we connect you with forex brokers and provide a community for traders. While we offer valuable information and resources, please note that we are not financial advisors and cannot provide personalized financial advice. Always conduct your own research and invest responsibly.

Community Guidelines: The MyTradingLand.com community is designed as a resource for forex traders, promoting respectful and constructive discussions. We reserve the right to remove any content that is misleading, abusive, or violates our terms of service.

Broker Information: While we may receive commissions or advertising income from some of the brokers listed, this does not imply an endorsement of any broker, nor does it affect our review process. Our evaluations are based solely on objective criteria and user feedback.

Always verify the regulatory status of any broker with your local financial authority, along with their terms and privacy policies, before engaging with them. It is crucial to conduct thorough research to ensure that you are making informed decisions.

Risk Warning: At MyTradingLand.com, we strive to provide accurate information; however, the forex market is highly volatile and can change rapidly. It is essential to verify any information before making investment decisions.

Please be aware that trading in forex involves substantial risk, and it is possible to lose more than your trading equity/investment capital. 70-90% of retail CFD traders incur losses in their trading activities as per information from various brokers.

You are solely responsible for your use of MyTradingLand.com and any trading decisions you make. We encourage all users to educate themselves thoroughly about forex trading and to consider seeking advice from qualified financial professionals.

Advertising Disclosure: We may earn commissions from recommended brokers, but our reviews are independent (not influenced by potential earnings). Sponsored content is clearly marked and doesn't reflect our views.

©2026 ©2025 All rights reserved Mytradingland.com